In the last few weeks of 2005, a discussion of signal-generator noise performance on the hp_agilent_equipment Yahoo group gave me a good excuse to test several well-known HP models with PN.EXE, my homebrew noise-measurement application for GPIB-equipped Windows PCs. My goal was twofold: to understand the strengths and weaknesses of the different signal sources in my "collection," comparing their observed performance figures with the factory's specifications; and to develop a noise-measurement methodology for sources which are, for the most part, too clean to measure directly on a conventional spectrum analyzer.
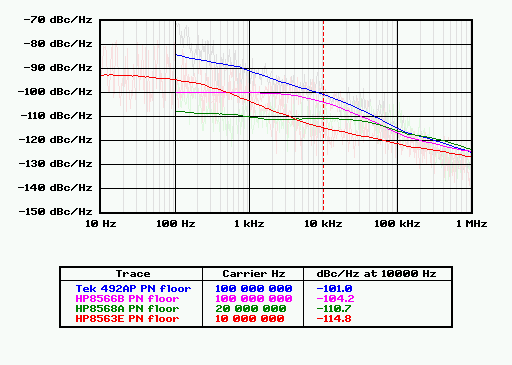
The graph at left shows the absolute phase-noise measurement limits for four different RF/microwave spectrum analyzers
commonly used in commercial and military environments. These analyzers are available on the surplus market at prices
ranging from that of a new TV set to that of a new car. Like most superheterodyne radio receivers, their
composite (AM+PM) noise floors are determined by the quality of their first local oscillators. And as with any high-quality
signal source, local oscillator performance is determined by complex and arcane mathematical
equations. To a first approximation, these equations all simplify to "$/kg/dBc/Hz."
Spectrum-analyzer manufacturers face a tough problem: to achieve image-free coverage from DC to the VHF/UHF/microwave region,
they need to use high IF frequencies, typically several GHz. That means their first local oscillators also have to
operate in the GHz range, where it's difficult and expensive to generate a spectrally-clean signal. Hewlett-Packard had it (relatively) easy
when they designed the popular signal generators tested here: none of these models has to tune past 1280 MHz, and the
whole box can be devoted to the problem, rather than only the first LO section of a larger instrument.
As a result, even lower-quality signal generators are difficult to characterize by simply connecting them to the RF input jack of a spectrum analyzer and looking at the resulting noise profile. Most of the noise will be from the analyzer's first LO, rather than the generator ostensibly being measured.
Lacking a dedicated noise measurement test set with a phase-locked reference source and quadrature mixer, we need a way to increase the phase noise of the signal under test relative to the amplitude of the signal itself. If we could raise the subject's noise to a level that's at least a few dB higher than the analyzer's own noise floor, we could measure it directly.
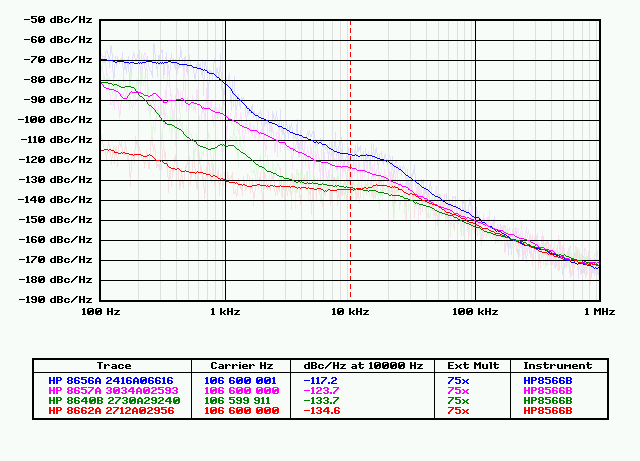
The solution used to obtain the graph at right was a microwave "brick" oscillator, an inexpensive and easy way to take advantage of the fact that FM noise and spurs on a signal will undergo amplification by 20 * log10(N) when the frequency of that signal is multiplied by N.
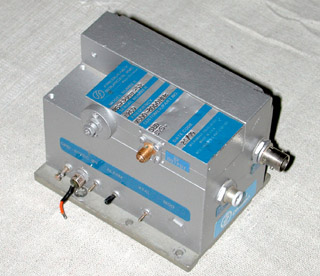
Brick oscillators are commonly available on eBay as surplus from telecom companies and other microwave radio users. These oscillator modules are actually self-contained PLL synthesizers. They accept a reference frequency in the lower VHF range and multiply it by a fixed N-factor to yield an output in the microwave spectrum. They're extremely expensive when new, dirt cheap on the surplus market, and built like brick, well, battleships.
It's easy to tell how to hook up most bricks -- there are few connections other than power, reference input and RF output, and they're usually labelled. Often there's a coarse frequency-adjustment control that can be used to center the brick's lock range around the intended carrier frequency.
This particular brick is a Frequency Sources (West Division) model MS-62XEL-52. I don't remember what I paid for the brick, but it wasn't more than $50. The MS-62XEL-52 is designed to multiply a signal from 100-106.7 MHz by 75x, resulting in a rated output frequency of 7500-8000 MHz. At better than +8 dBm, its output power is ample for high-dynamic range measurement purposes.
Thanks to the brick's 75x multiplication ratio, the LO noise floor of the HP 8566B spectrum analyzer was effectively lowered by 20 * log10(75) = 37.5 dB. (PN.EXE can apply a frequency-multiplication factor automatically, eliminating any need to correct the graph data after the measurement.)
The 37.5-dB improvement is enough to close the gap between the specs of the HP 8566B's local oscillator and most of the generators being tested. However, there are a few caveats when using a brick for noise-measurement purposes:
- Bricks usually accept a very narrow range of input (reference) frequencies. In this case, the brick can be adjusted for
use with inputs between 99-111 MHz... and that's not much elbow room, unless you happen to be testing wide-range signal generators. In other
test scenarios, you may need to use mixing and/or multiplication prior to the brick to obtain a reference signal it will accept.
- The 20*log(N) improvement may not be enough. When it comes to close-in noise, the clear winner of the signal-generator
shootout is the HP 8662A, a complex synthesizer targeted at radar and noise-measurement applications. If the HP 8662A were any cleaner,
the HP 8566B analyzer couldn't measure it even with the help of a 75x brick.
As things stand, the trace between 1 and 5 kHz is closer to the -137.5 dBc/Hz noise floor in that area than we'd like... especially when we remember that the analyzer baseline traces above were made in the lower VHF range, not the 8-GHz output frequency of our brick. Most of the time, the analyzer's phase noise will get worse at higher frequencies.
Another consideration is the fact that the analyzer may have to use harmonic mixing to observe the output of a microwave brick. When an HP 8566B tunes to 8 GHz, it uses its first LO's second harmonic. There goes 6 dB of our LO noise-floor improvement! For these reasons, it's safe to say that the HP 8662A is actually a bit cleaner than the graph suggests.
- The brick's PLL has a finite loop bandwidth. At offsets beyond the loop bandwidth, the output signal's phase-noise profile gradually becomes that
of the brick's internal VCO, rather than its multiplied reference. The 20*log(N) noise improvement applies only within
the loop bandwidth, so graphs recorded by PN.EXE will tend to show unrealistically-low noise levels at wide offsets when using a brick.
Test sources with very different noise characteristics will appear to converge. The graph above exhibits both of these effects
at offsets past the MS-62XEL-52's loop bandwidth of approximately 20-30 kHz.
- The brick's PLL may exhibit noise peaking within its loop bandwidth. Updated December 17, 2006 An earlier draft of this page accused
the Frequency West brick of excessive noise peaking in the 10-kHz range, but some additional experimentation on
another project suggests that the residual noise of the HP 8566B's YTO loop may have been more at fault
when I made my original measurements. The 8566B's YTO loop
gain is designed to increase in spans wider than 25 kHz, for reasons its service manual does not make clear. This
makes the YTO loop a significant potential contributor to the measurement noise floor in the 10 kHz - 100 kHz decade.
I've modified PN.EXE to acquire this decade using a series of narrower spans, and I plan to attempt to reproduce the earlier noise-peaking measurements of the MS-62XEL-52 at a future time when all the necessary hardware is on the bench at once.
Technical Correspondence
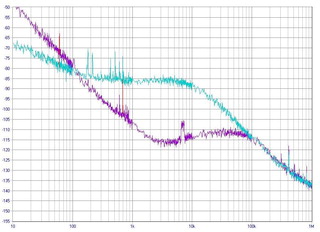 January 12, 2006 Walter Dail, KT4JA, sends along an interesting plot from an Aeroflex PN9000B
phase noise test set. The purple trace is an M/A-Com PLL brick running at 10.136 GHz. The
brick is multiplying its internal 99-MHz crystal reference by 102x. Shown for comparison in the cyan trace
is an HP 83732B signal generator tuned to the same frequency.
At about 150 kHz, the loop bandwidth of this brick is wider than the Frequency Sources part, and it exhibits even more peaking, as well as a few "phase hits" here and there. Total integrated noise reported by Walter is 0.696 degrees RMS for the brick and 0.546 degrees RMS for the HP 83732B.
January 17, 2007 Some measurements of a high-quality 10 GHz PLL-controlled dielectric resonator oscillator, the PLO-2000 from Microwave Dynamics, appear below. You can click the graph for a more-detailed view.
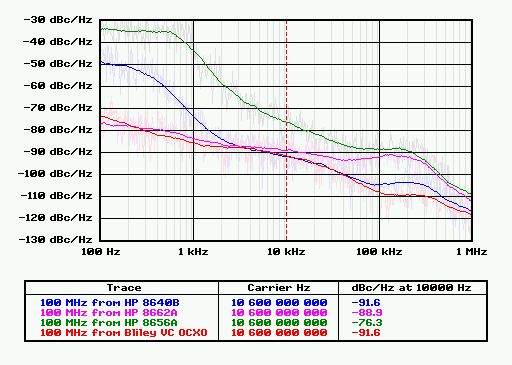 These noise traces reflect the DRO PLL's 10.6-GHz output, rather than its 100-MHz input signal. You can add -41 dBc/Hz to
the noise levels in this graph to compare them to the values in the earlier graphs. (Also note that the HP 8640B cavity
used here is much cleaner than the one used to obtain the earlier graphs above.)
The Microwave Dynamics part is a better noise-measurement aid than the Frequency West brick used above. Its loop bandwidth appears to be 300-400 kHz. You can really see how much cleaner the 8640B is above 10-20 kHz, compared to the 8662A!
Additionally, because this source will work with a 100 MHz input signal, I was able to use a Bliley 100 MHz OCXO to drive it directly. The resulting trace (in red) makes a good 100 Hz - 100 kHz noise baseline trace for the HP 8566B at 10 GHz... something I've never been able to obtain before.